
Related Articles

Welcoming the Stranger
Presenter: Matthew Soerens, US Director of Church Mobilization, World Relief Description: Refugee and immigration issues have dominated headlines globally recently. While many American Christians view these…

The Global Impact of George Verwer
By David Greenlee and Greg Kernaghan | George Verwer, founder of Operation Mobilisation, passed away on April 14, 2023. His impact in global missions reverberated far beyond the boundaries of OM. God used him to help shape its multicultural and multinational the future.
Cultural Anthropology to Modern Missions
Cultural anthropology can and should be harnessed as a necessary and practical aid for the task of knowing the soils of individual people within cultures and sub-cultures.
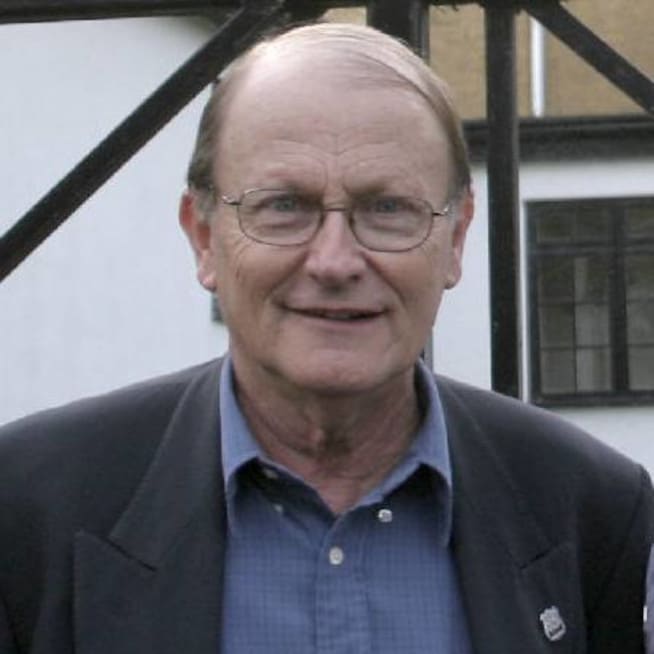
Why I have been weeping over the death of George Verwer
Are the values and assumptions of various cultures in conflict with adult learning principles, or are these principles culturally transferable?

From Unhealthy Dependency To Local Sustainability
Presented by: Jean A. Johnson, Executive Director of Five Stones Global Description: It takes a great amount of intentionality to create a culture of dignity,…